
Over the past decade or so I have used different methods to search for undervalued dividend growth stocks. I don’t believe I have the answer as to one metric being better than all other metrics, and while some back testing would provide some insight if there was one end all be all answer there wouldn’t be thousands of hedges funds and mutual funds/ETFs. As such, from time to time I will update this post to provide for my next iteration of screening.
This account is easily my favorite asset for a few reasons:
- I am creating a future passive income stream;
- It is inexpensive to build;
- It can be ramped up and scaled back without headaches;.
Finding Undervalued Dividend Growth Stocks
For the time being I am going to use the following metrics to search for companies that have consistently distributed a growing dividend that may be considered undervalued when looking at various metrics.
Dividend Growth History
First and foremost, my first screen is to eliminate any company that has not increased their dividend for at least 20 years. I have decided to use the Dividend Champions (25yr+) and part of the Dividend Contenders (10 to 24yrs) lists which were created by David Fish and continued to be maintained at The Dividend Investing Resource. Those lists differ from the Dividend Aristocrat List which has restrictions that just don’t particularly matter to me (market cap, stock liquidity concerns, being on the S&P500, etc.).
Price to Earnings
The first value metric that most people learn about is the Price to Earnings Ratio (P/E). According to investopedia,
The price-to-earnings ratio (P/E ratio) is the ratio for valuing a company that measures its current share price relative to its per-share earnings (EPS). The price-to-earnings ratio is also sometimes known as the price multiple or the earnings multiple.
P/E ratios are used by investors and analysts to determine the relative value of a company’s shares in an apples-to-apples comparison. It can also be used to compare a company against its own historical record or to compare aggregate markets against one another or over time.
The P/E of the S&P500 over time has a mean/median over around 15:
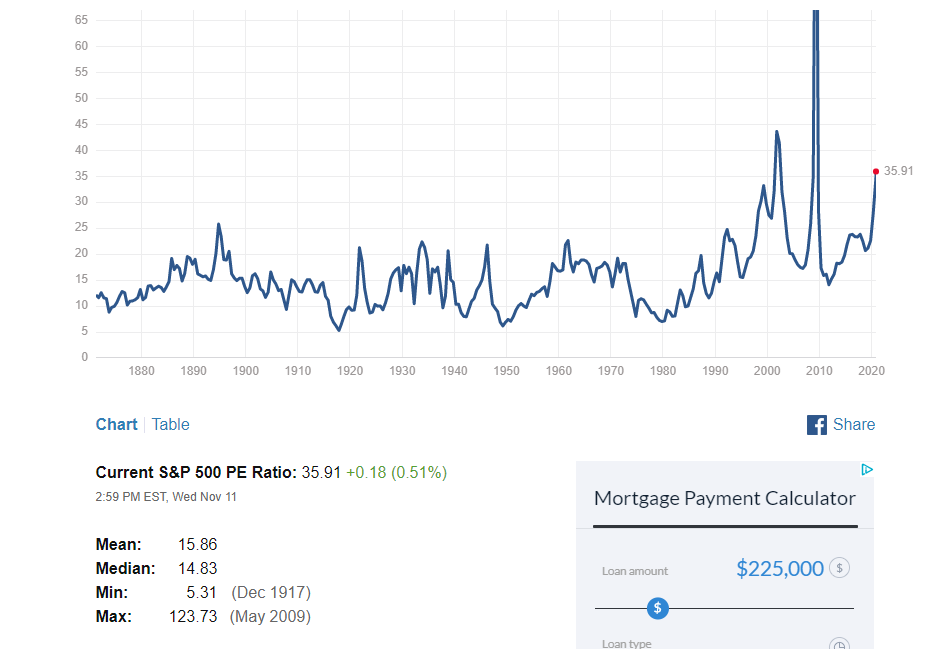
For the time being I am going to eliminate those companies whose P/E is below 20.
Dividend Payout Ratio
Since I am interested in a sustainable, growing dividend a dividend cut can decimate a position. As such, it is important that the company has a reasonable dividend payout ratio. The Dividend Payout Ratio is,
is the ratio of the total amount of dividends paid out to shareholders relative to the net income of the company. It is the percentage of earnings paid to shareholders in dividends. The amount that is not paid to shareholders is retained by the company to pay off debt or to reinvest in core operations. It is sometimes simply referred to as the ‘payout ratio.’
The dividend payout ratio provides an indication of how much money a company is returning to shareholders versus how much it is keeping on hand to reinvest in growth, pay off debt, or add to cash reserves (retained earnings).
I am going to use 50% as my upper threshold. I know that this will remove REITs that have to pay out 90%+ for tax purposes, but I am comfortable with that at the current time given, however, this may change in the future.
5 Year Positive Earnings Per Share
In addition, to provide for further safety of the dividend, I want to make sure that the company has been consistently earning real money for the past 5 years. Earnings per share is calculated as,
the net income (also known as profits or earnings) divided by the available shares. A more refined calculation adjusts the numerator and denominator for shares that could be created through options, convertible debt, or warrants. The numerator of the equation is also more relevant if it is adjusted for continuing operations.
There are various ways to dig even deeper (diluted, excluding extraordinary, etc.) however due to screen restrictions I am using basic.
My Undervalued Dividend Growth Screen

Using Finviz, once a month until (until I update the inputs) I am going to run the above stock screen. I will then cross reference the results with the dividend champions as well as a small portion of the dividend contenders. Once I have the few remaining companies I can determine how to purchase that month’s position.