
I hope one day to have a steady stream of income provided by multiple companies with a long standing history of increasing their dividend annually. In my mind it is almost like creating my own private pension. Due to other focuses right now (specifically, pay down the debt I just took on to finish up my pool) I have slowed down my screen and investment from a monthly to every “so often.” With all the turmoil in the markets I thought now would be a good time to run the screen and see if anything interesting pops up.
Previous Screens From this Year:
Dividend Stocks with 20+ Years of Dividend Growth
First and foremost, I want companies that have dividend growth in their DNA. As such, I use the Dividend Champion (25+yrs) and part of the Dividend Contenders List (20+ Years). While the number will change month to month it should be unusually stable as companies don’t often drop off (and to get on they would have had to started while Bush was President, and survived the dot.com bubble, 2007 – 2009 and the first phase of COVID).
This provides me with 171 companies that have increased their dividend for the past 20 years (in February that amount was 167).
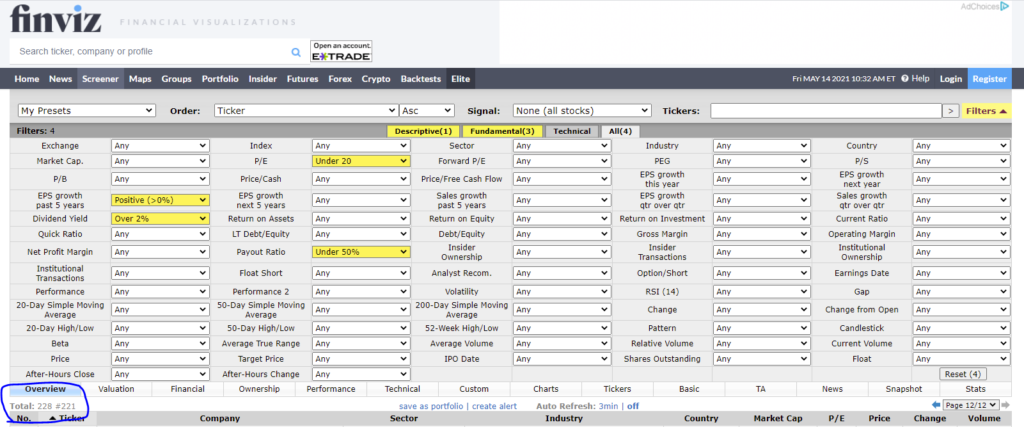
Metric Screens
Once I have those companies I can screen them for particular metrics. Please review my larger discussion on screening for undervalued dividend growth stocks for definitions and thoughts on each:
- Company has to have a P/E under 20;
- A Dividend Yield of over 2%;
- Payout Ratio under 50%; and
- Positive EPS Growth for the past 5 years.
Now to cross reference the two lists to see what I end up.
My Third Undervalued Divided Growth Watch List for 2021
| Company | Sector | Industry | |
| ADM | Archer-Daniels-Midland Company | Consumer Defensive | Farm Products |
| AFL | Aflac Incorporated | Financial | Insurance – Life |
| AROW | Arrow Financial Corporation | Financial | Banks – Regional |
| ATO | Atmos Energy Corporation | Utilities | Utilities – Regulated Gas |
| CINF | Cincinnati Financial Corporation | Financial | Insurance – Property & Casualty |
| CTBI | Community Trust Bancorp, Inc. | Financial | Banks – Regional |
| EBTC | Enterprise Bancorp, Inc. | Financial | Banks – Regional |
| FLIC | The First of Long Island Corporation | Financial | Banks – Regional |
| GD | General Dynamics Corporation | Industrials | Aerospace & Defense |
| MCY | Mercury General Corporation | Financial | Insurance – Property & Casualty |
| MDU | MDU Resources Group, Inc. | Basic Materials | Building Materials |
| NC | NACCO Industries, Inc. | Energy | Thermal Coal |
| ORI | Old Republic International Corporation | Financial | Insurance – Diversified |
| OZK | Bank OZK | Financial | Banks – Regional |
| SBSI | Southside Bancshares, Inc. | Financial | Banks – Regional |
| SRCE | 1st Source Corporation | Financial | Banks – Regional |
| THFF | First Financial Corporation | Financial | Banks – Regional |
| TMP | Tompkins Financial Corporation | Financial | Banks – Regional |
| TROW | T. Rowe Price Group, Inc. | Financial | Asset Management |
| UGI | UGI Corporation | Utilities | Utilities – Regulated Gas |
| NUS | Nu Skin Enterprises, Inc. | Consumer Defensive | Household & Personal Products |
| CATC | Cambridge Bancorp | Financial | Banks – Regional |
| PB | Prosperity Bancshares, Inc. | Financial | Banks – Regional |
| RBCAA | Republic Bancorp, Inc. | Financial | Banks – Regional |
| SJM | The J. M. Smucker Company | Consumer Defensive | Packaged Foods |
Look at all those regional banks! Instead of digging deep into each one, or the metrics that would make one better than another I decided to just move away from them leaving me with:
- ADM
- AFL
- ATO
- CINF
- GD
- MCY
- MDU
- NC
- ORI
- TROW
- UGI
- NUS
- SJM
Next I put those against their 52 week high and 52 week low for a margin of saftey
| 52 Week High | 52 Week Low | ||||||
| ADM | 67.74 | 68.68 | 0.94 | 1.39% | 33.01 | 34.73 | 51.27% |
| AFL | 56.41 | 57.35 | 0.94 | 1.67% | 30.32 | 26.09 | 46.25% |
| ATO | 100.84 | 107.02 | 6.18 | 6.13% | 84.59 | 16.25 | 16.11% |
| CINF | 120.96 | 122.8 | 1.84 | 1.52% | 46.07 | 74.89 | 61.91% |
| GD | 191.67 | 197.51 | 5.84 | 3.05% | 129.11 | 62.56 | 32.64% |
| MCY | 66.95 | 67.88 | 0.93 | 1.39% | 35.21 | 31.74 | 47.41% |
| MDU | 34.39 | 35.02 | 0.63 | 1.83% | 18.5 | 15.89 | 46.21% |
| NC | 25.98 | 30.71 | 4.73 | 18.21% | 17.95 | 8.03 | 30.91% |
| ORI | 26.22 | 26.48 | 0.26 | 0.99% | 13.08 | 13.14 | 50.11% |
| TROW | 191.12 | 192.1 | 0.98 | 0.51% | 105.56 | 85.56 | 44.77% |
| UGI | 46.14 | 46.73 | 0.59 | 1.28% | 26.95 | 19.19 | 41.59% |
| NUS | 58.58 | 63.85 | 5.27 | 9.00% | 31.3 | 27.28 | 46.57% |
| SJM | 136.79 | 139.57 | 2.78 | 2.03% | 101.89 | 34.9 | 25.51% |
Interestingly, both are in a sector that I have no exposure, energy:
NACCO Industries, Inc.® is an American publicly traded holding company, headquartered in Cleveland, Ohio. Through a portfolio of mining and natural resources businesses, the company operates under three business segments: Coal Mining, North American Mining and Minerals Management
Atmos Energy Corporation, headquartered in Dallas, Texas, is one of the United States’ largest natural-gas-only distributors, serving about three million natural gas distribution customers in over 1,400 communities in nine states from the Blue Ridge Mountains in the East to the Rocky Mountains in the West.
Atmos Energy also manages company-owned natural gas pipeline and storage assets, including one of the largest intrastate natural gas pipeline systems in Texas
I am going to open a small position in each (just $500/company).