
I have been selling naked puts for years. I first learned about the technique from a very good buddy of mine. The idea immediately spoke to me, and I become semi-obsessed with it. In the beginning, I would track every trade, which became annoying at best and led me to stop tracking the gain/loss on any trades.
In addition, in the past 18 to 24 months I got stomped out hard twice. The technique is often described as picking up pennies in front of a slow moving steamroller, and twice the steamroller won. Those two incidents had the same thing in common – both were a broad market draw downs rather than specific sectors or stocks (first one was late 2018 and the second was COVID).
What Does it Mean to Sell Naked Puts? and How do I use the Strategy?
A put is a type of options contract where, in the simplest terms, one party can force another to take on the stock of a company at a predetermined price. There are plenty of other resources on the interwebs about the definitions of different options contracts, and since I am pretty sure I am talking to myself at this point, I am not going too much deeper than that.
The strategy I am most obsessed with is selling out of the money (OTM) naked puts wherein I take the risk that some of the largest companies in America are not going to drop 10%, 15%, or even 20% from where they are. For that bet I am paid a small premium (the pennies in front of the steamroller). Those times where just one stock gets put to me it isn’t a huge deal because I then just hold the stock and sell covered calls against the position until it is assigned. The problem is when everything shits the bed (see above). The strategy I am employing is “naked” in nature where I have no downside protection most of the time.
My favorite type is when a stock drops after an earnings call. For example this week, Dollar Tree took a nose dive after their earnings call:

The stock dropped 7%. I then took a look at the P/E of the company which landed at 17 and the historical PE of DLTR:
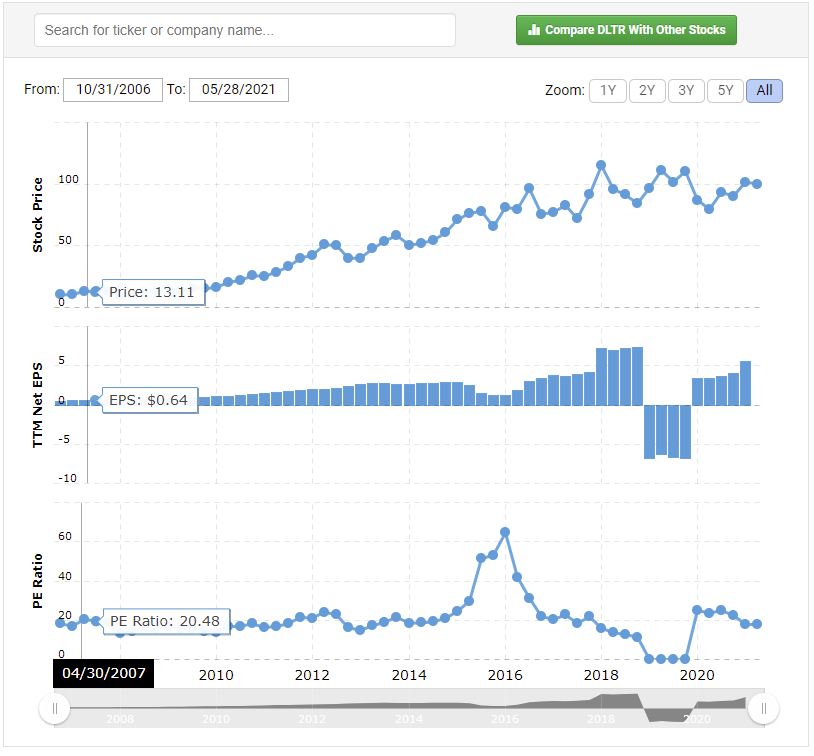
You can see from that bottom graph it is kind of where it has traded over the past 10 years. This may seem like a lot of work, but it took all of about 7mins. I then put a bunch of “bets” that the 7% was the fall out from the earnings call which at a very high level didn’t seem awful. One “bet” closed out already but here they are:

Lots of numbers there, but basically it says that for $120 premium (I received $40 for the other contract that is shown as closed) I don’t think that Dollar Tree is dropping another 12%+ inside 35 days. I will then buy back the contract when the contract drops in price usually either half of what I received, or in extreme cases like the one above for $5 or $10/contract.
What I learned from the two stomp outs I need to pump the breaks a bit. In the past I would bring my maintenance amount down to low thousands, so any negative move in a sector or even a stock would cause a shit storm. Not anymore – at least not after March of last year! I am keeping that sucker in the tens of thousands for the time being. Notwithstanding, for the past year or so, it was something I just did haphazardly with no real direction and that is when I realized I needed a way to track this investment strategy.
My New Plan to Track Selling Naked Puts
Once I realized, I needed a way to track I asked myself, why am I selling naked puts? It is to generate income to then invest into dividend growth stocks, so I am not just relying on my earned income to fund the account. So if I care about generating income, why not just track the income! Seems pretty simple.
I wanted to give myself a goal so I decided on $25/day of cleared investment income for the first 6 to 8 weeks, and then at that point, I will reevaluate – if I am hitting the goal week in and week out I will need to up it a bit or if I am not I will bring it down. Cleared investment income to me means any new contract(s) sold that day (money in) minus any contracts closed out (money out), and netting it all out. The account is worth a bit under $50k, so if I can generate $25/day on average and there are about 250 trading days, that will generate a bit over $6k which can then be reinvested into the account. Of course, when man plan, god laughs.
I’m excited to put a bit more focus on this account. It is my goal that one day future Accumulator can simply turn off dividend reinvestment and have another income stream to rely on. While I am light years away from that future, this feels like a step in the right direction.